Something about hotdogs...
- arsabacusbusiness
- Jun 21, 2024
- 2 min read
Life unfolds in unpredictable ways... It's hard to say what you'll be doing tomorrow.
So, the guy (an IT specialist) found himself selling hot dogs. At least he's working for himself. The cost of a hot dog is 2 units of currency (the specific currency doesn't matter). He used his brains and started to gradually vary the price to increase his revenue. The idea is sound: observe how people buy and find the point of maximum revenue.
First and foremost, it was necessary to determine if there was any relationship between price and sales (laziness wisely suggests avoiding unnecessary work), i.e., find the correlation coefficient and check its statistical significance. The results are quietly encouraging: the coefficient is both high and statistically significant. He used Spearman's rank correlation to avoid testing the sample for normality.
Spearman's rank correlation rho:
S = 568.49, p-value = 2.135e-09
alternative hypothesis: true rho is not equal to 0
sample estimates:
rho = -0.9877423

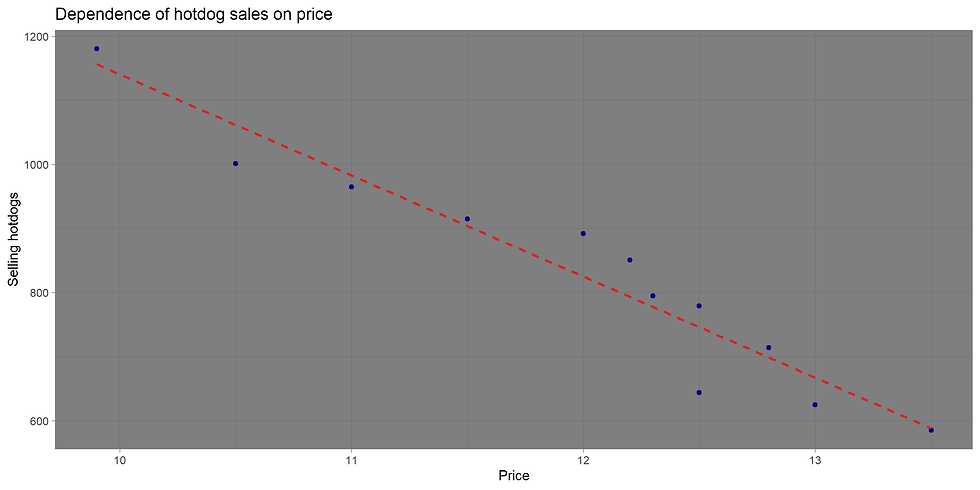
He plotted the results on a graph (Fig. 1) and pondered. At the very least, he wondered what to do next. The interval is limited, and the conclusion is clear: the higher the price, the fewer the sales. But this doesn't answer the question of what price will maximize profit.
The main workhorse of data analysis—Linear Model—comes to the rescue. Let's build a model of the form:
Sales ~ Price. (1)
It looks better, now there's a model (Fig. 2):
Sales = 2717.7 - 157.7*Price (2)
shown as the red dashed line on the graph. The IT guy didn't check the model for compliance with the Gauss-Markov theorem (I'll check it later when I have time—familiar to everyone!). But the question remained: at what price will the hot dog yield the highest revenue?
Let's continue. It's very likely that this price might not lie within the observed interval. Here, we'll use the coefficients from model (2), obtained by the least squares method. We'll create a revenue model:
Revenue = Sales * Price = (2717.7 - 157.7*Price) * Price (3)
This model is quadratic, with the parabola opening downwards, indicating a maximum somewhere. We'll compile all the data into one graph (Fig. 3). On the graph: solid green is the revenue over the interval from 2 units (cost) to 14 units (end of observations), blue and red as in Figs. 1 and 2. The result: the optimal price is bash
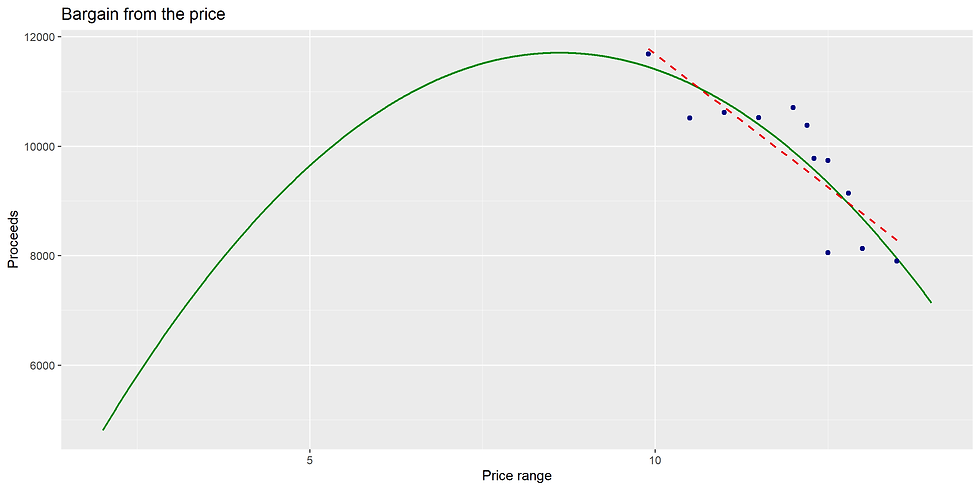
8.62 units/hot dog.
And our hero realized—he understood the purpose of regression!
But he needed to verify the result. He took the derivative of revenue with respect to price and set it to zero:
Revenue' = 2717.7 - 2157.7Price = 0 (4)
and got
8.617 units/hot dog.
This is not the end of the story!
Comments