Forecasting NVDA.
- arsabacusbusiness
- Jun 20, 2024
- 1 min read
A forecast for the NVDA time series has been presented. The series is
clearly non-stationary, showing a trend with consistent growth,
which corresponds to reality. The forecasted values are provided in the
table and were compared with the actual ones.
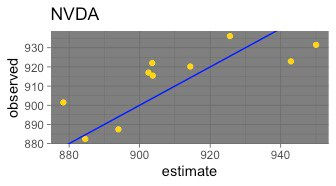
The results of the comparison between the estimated and observed values
are displayed on a Sheppard diagram. Additionally, an analytical measure
of association, Kendall's tau, was obtained, which is approximately 0.69.
This indicates a strong correlation between the forecast and reality.
Moreover, this correlation is statistically significant (p-value = 0.0047). T
he maximum error was around 3% (2.56%).
Comments