Cointegrating combination
- arsabacusbusiness
- Jun 20, 2024
- 1 min read
In the previous post, it was established that the number of cointegrating vectors is at least two. Therefore, we must consider pairwise cointegration relationships. The first pair consists of the time series BTC and ETH, represented in blue and green on the graph, respectively.
Cointegration of time series generally indicates a long-term dependency between them, leading to some mutual, interconnected changes. The matrix for analyzing the rank of cointegration
r is as follows:
test 10pct 5pct 1pct
r <= 1 | 6.25 7.52 9.24 12.97
r = 0 | 23.16 17.85 19.96 24.60
Using the Johansen procedure, at the 5% significance level (5pct), the null hypothesis
r=0 is rejected, and the null hypothesis r≤1 (6.25 (test) ≤ 9.24 (5pct)) is accepted, indicating that at least one cointegrating vector exists. The cointegrating combination is given by:
BTC=−22.86539⋅ETH+12823.42+ϵ
In the diagram, this is represented in red, with the yellow line corresponding to the average. The linear combination
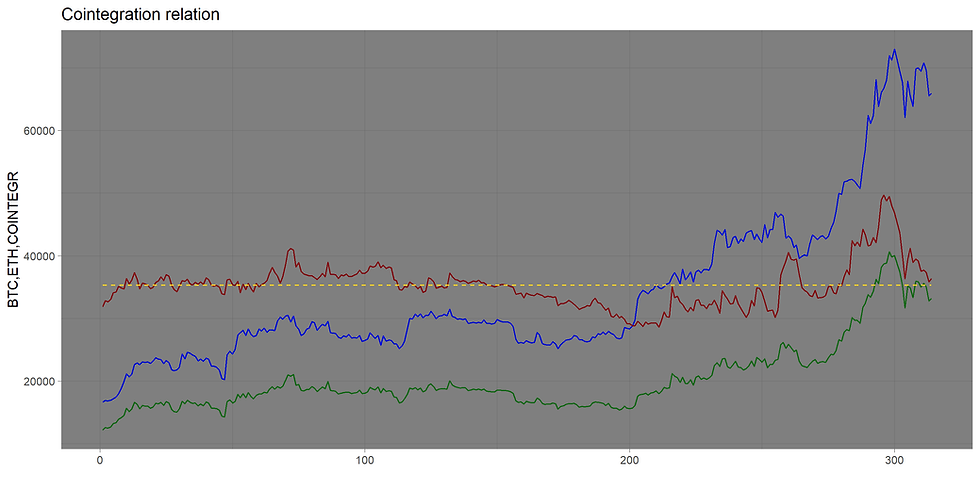
BTC+22.86539⋅ETH should form a stationary series, which was tested using the augmented Dickey-Fuller test (p-value = 0.4379, indicating non-stationarity of the series).
Commenti